
How Do We Know If an AI Model Is Actually Good? A Complete Guide to AI Performance Metrics
Artificial Intelligence systems are everywhere today—from recommendation engines on streaming platforms to fraud detection systems in banking and diagnostic tools in healthcare. Yet one fundamental question remains at the heart of every AI system: how do we know whether an AI model is performing well? Simply building a machine learning model is not enough. Without proper performance measurement, an AI system can produce misleading predictions, biased outcomes, or unreliable decisions that affect real-world users.
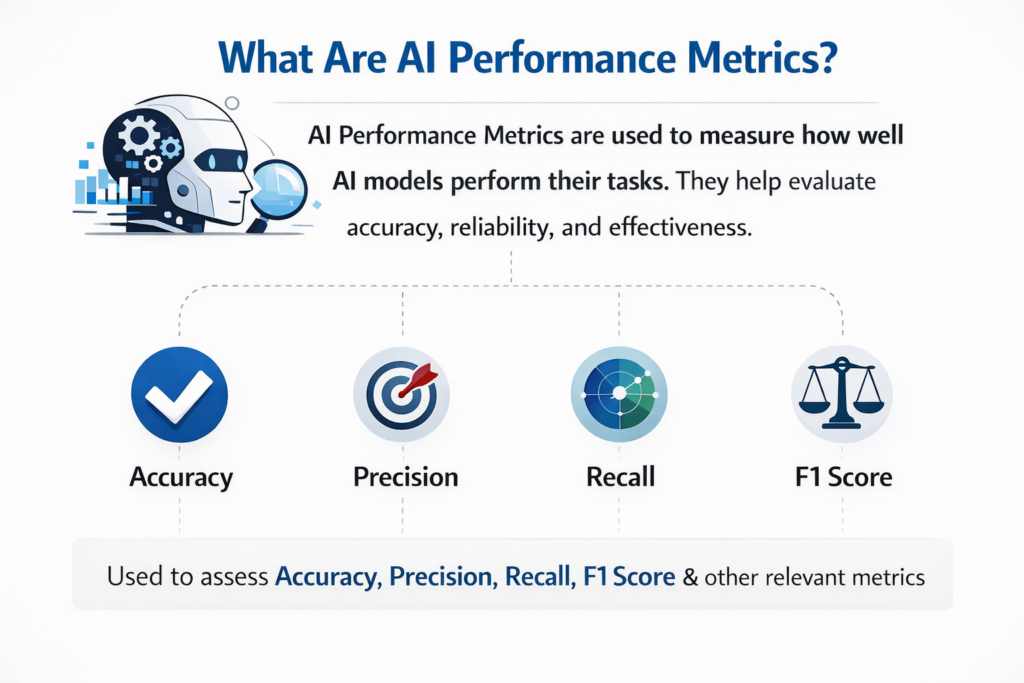
This is where AI performance metrics become essential. These metrics help data scientists, researchers, and engineers evaluate how accurately and reliably an AI system performs its intended task. Whether the model predicts customer churn, identifies objects in images, detects spam emails, or generates recommendations, performance evaluation determines whether the system is trustworthy and ready for real-world deployment.
In this comprehensive guide, we will explore how AI performance is measured using various evaluation metrics, understand when to use them, and see how they differ depending on the type of AI problem being solved. By the end of this article, students, professionals, and AI enthusiasts will have a clear understanding of the key metrics used to evaluate machine learning models and why they matter in real-world AI applications.
Understanding AI Performance Measurement
Performance measurement in AI refers to the process of quantifying how well a machine learning model performs on a given task. In simple terms, it answers the question: How accurate, reliable, and useful is the AI model’s prediction?
Machine learning models learn patterns from data, but their predictions must be tested on unseen data to determine how well they generalize beyond the training dataset. This evaluation typically involves comparing predicted outputs with the actual ground truth values using predefined statistical metrics.
The choice of metric depends on the type of machine learning problem, which typically falls into categories such as:
- Classification problems – predicting categories or classes
- Regression problems – predicting continuous numeric values
- Clustering problems – grouping similar data points
- Ranking and recommendation problems – ordering items by relevance
Each type of problem requires different evaluation metrics because the nature of the predictions differs.
Why AI Performance Metrics Matter
AI models often operate in environments where decisions carry significant consequences. A small prediction error may lead to financial loss, misdiagnosis, or biased hiring recommendations. Therefore, performance metrics provide a scientific and standardized way to measure model effectiveness.
Key reasons why AI performance evaluation is important include:
1. Ensuring model reliability
Metrics allow developers to verify that the model performs consistently across different datasets.
2. Comparing different models
When multiple algorithms are trained for the same task, evaluation metrics help determine which model performs best.
3. Detecting bias and imbalance
Certain metrics indicate whether the model is biased against specific classes.
4. Improving model performance
By analyzing metric results, data scientists can adjust model parameters, features, or algorithms to improve outcomes.
Without proper metrics, AI development would rely on guesswork rather than data-driven validation.
Key Performance Metrics for Classification Models
Classification is one of the most common machine learning tasks. Examples include spam detection, disease diagnosis, and sentiment analysis. Several metrics are used to evaluate classification models.
Accuracy
Accuracy is the simplest and most intuitive performance metric. It measures the proportion of correct predictions made by the model compared to the total number of predictions.
Accuracy is calculated as:
Accuracy = (Correct Predictions) / (Total Predictions)
For example, if a model correctly predicts 90 out of 100 samples, its accuracy is 90%.
Accuracy works well when the dataset is balanced, meaning each class appears roughly equally. However, it becomes misleading in imbalanced datasets.
For instance, imagine a fraud detection system where only 1% of transactions are fraudulent. A model that predicts “not fraud” for every transaction would still achieve 99% accuracy, even though it fails to detect actual fraud.
Therefore, more advanced metrics are required.
Precision
Precision measures how many of the predicted positive cases are actually correct.
Precision focuses on the quality of positive predictions.
Precision = True Positives / (True Positives + False Positives)
High precision means the model makes very few false positive mistakes. This metric is particularly important in scenarios where false alarms are costly.
For example:
- Email spam filters
- Medical diagnoses
- Fraud detection systems
In these situations, incorrectly labeling something as positive could create unnecessary problems.
Recall (Sensitivity)
Recall, also known as sensitivity, measures how many actual positive cases were correctly identified by the model.
Recall = True Positives / (True Positives + False Negatives)
This metric focuses on how well the model captures all positive cases.
High recall is important when missing a positive case would be dangerous.
Examples include:
- Detecting cancer in medical imaging
- Identifying fraudulent financial transactions
- Detecting security threats
In such situations, missing a positive instance can have serious consequences.
F1 Score
The F1 Score is a combined metric that balances both precision and recall.
It is calculated as the harmonic mean of precision and recall.
F1 Score = 2 × (Precision × Recall) / (Precision + Recall)
The F1 score becomes particularly useful when:
- The dataset is imbalanced
- Both false positives and false negatives matter
A high F1 score indicates a good balance between identifying positives correctly and avoiding false alarms.
Confusion Matrix
A confusion matrix provides a detailed breakdown of classification results. It shows how predictions are distributed across actual and predicted classes.
The matrix includes four components:
| Actual / Predicted | Positive | Negative |
|---|---|---|
| Positive | True Positive | False Negative |
| Negative | False Positive | True Negative |
From this matrix, several metrics like precision, recall, and accuracy can be calculated.
Confusion matrices are extremely useful because they provide a complete picture of model performance, rather than relying on a single number.
Performance Metrics for Regression Models
Regression models predict continuous numeric values, such as house prices, temperature forecasts, or stock market trends. Different evaluation metrics are used for these problems.
Mean Absolute Error (MAE)
Mean Absolute Error measures the average magnitude of prediction errors without considering their direction.
MAE = Average(|Actual Value − Predicted Value|)
This metric gives a clear understanding of how far predictions deviate from actual values on average.
MAE is simple to interpret and is widely used in forecasting applications.
Mean Squared Error (MSE)
Mean Squared Error measures the average squared difference between predicted and actual values.
MSE = Average((Actual − Predicted)²)
Squaring the errors penalizes larger mistakes more heavily. This makes MSE useful when large errors must be avoided.
However, because the errors are squared, the units become harder to interpret.
Root Mean Squared Error (RMSE)
Root Mean Squared Error is simply the square root of MSE.
RMSE = √MSE
This metric brings the error measurement back to the original unit of the target variable, making interpretation easier.
RMSE is widely used in regression problems like:
- Energy consumption prediction
- Demand forecasting
- Financial modeling
R-squared (Coefficient of Determination)
R-squared measures how well the model explains the variability of the target variable.
It ranges from 0 to 1, where:
- 0 means the model explains none of the variance
- 1 means the model perfectly explains the variance
Higher R-squared values indicate that the model fits the data well.
However, R-squared alone should not be used as the only evaluation metric because it does not measure prediction error directly.
Metrics for Clustering and Unsupervised Learning
In unsupervised learning tasks such as clustering, there are no labeled outputs. Therefore, different evaluation techniques are used.
Silhouette Score
The Silhouette Score measures how similar a data point is to its own cluster compared to other clusters.
The score ranges from −1 to +1.
- Values close to 1 indicate well-separated clusters
- Values near 0 indicate overlapping clusters
- Negative values suggest incorrect clustering
This metric is widely used to evaluate algorithms such as K-Means clustering.
Davies-Bouldin Index
The Davies-Bouldin Index measures cluster similarity.
Lower values indicate better clustering because clusters are compact and well separated.
It evaluates both:
- Cluster compactness
- Cluster separation
Comparison of Common AI Performance Metrics
| Metric | Used For | Key Purpose | Advantage | Limitation |
| Accuracy | Classification | Overall correctness | Simple to understand | Misleading for imbalanced data |
| Precision | Classification | Correct positive predictions | Reduces false positives | Ignores false negatives |
| Recall | Classification | Captures actual positives | Reduces missed positives | May increase false positives |
| F1 Score | Classification | Balance between precision and recall | Useful for imbalanced data | Harder to interpret |
| MAE | Regression | Average error magnitude | Easy interpretation | Does not penalize large errors strongly |
| MSE | Regression | Squared error measurement | Penalizes large errors | Harder to interpret |
| RMSE | Regression | Root of squared error | Interpretable error scale | Sensitive to outliers |
| R² Score | Regression | Model explanatory power | Indicates variance explained | Not a direct error measure |
| Silhouette Score | Clustering | Cluster separation | Easy cluster evaluation | Depends on distance metric |
Choosing the Right AI Performance Metric
Selecting the right metric depends heavily on the problem context and business objective.
For example:
- In fraud detection, recall is critical because missing fraud cases is costly.
- In email spam filtering, precision is more important to avoid marking legitimate emails as spam.
- In price prediction models, RMSE or MAE provides meaningful error estimates.
Therefore, experienced data scientists rarely rely on a single metric. Instead, they analyze multiple metrics together to obtain a comprehensive understanding of model performance.
The Role of Cross-Validation in AI Performance Evaluation
Beyond metrics themselves, AI systems must also be evaluated using reliable testing techniques.
One commonly used method is cross-validation, where the dataset is split into multiple training and testing subsets. The model is trained and evaluated multiple times using different splits.
This approach helps:
- Reduce overfitting
- Ensure consistent model performance
- Provide more reliable evaluation results
Cross-validation is widely used in machine learning pipelines before deploying models in production environments.
Final Thoughts
Measuring AI performance is one of the most critical stages in building reliable machine learning systems. Without proper evaluation metrics, developers cannot determine whether a model is accurate, trustworthy, or ready for real-world deployment.
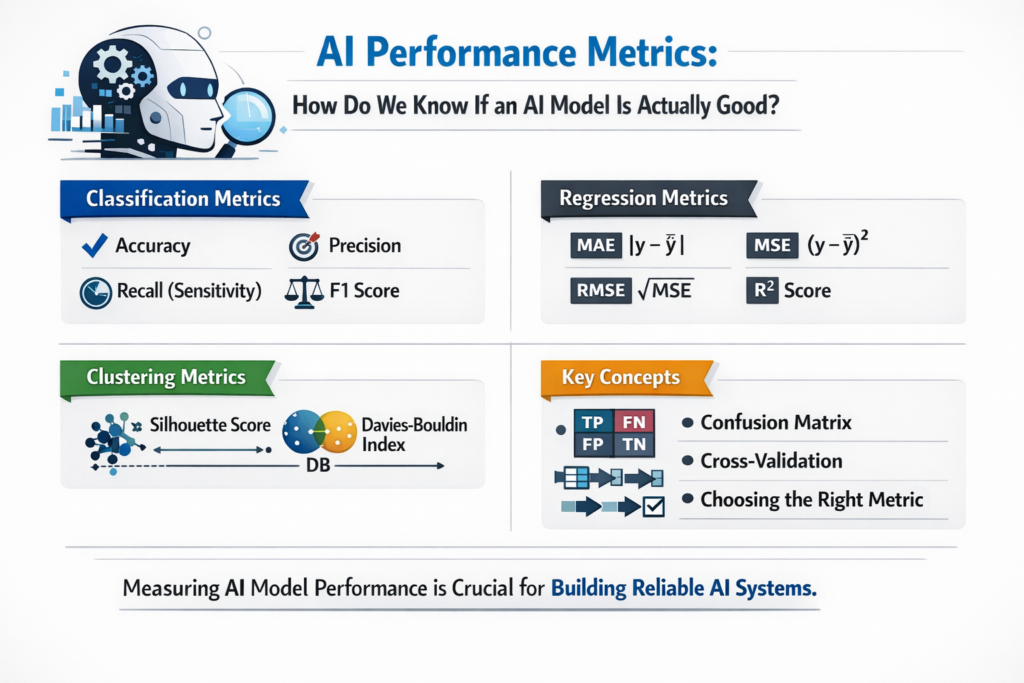
Different types of machine learning tasks require different metrics. Classification models rely on accuracy, precision, recall, and F1 score. Regression models use MAE, MSE, RMSE, and R-squared. Meanwhile, clustering algorithms are evaluated using metrics like the silhouette score and Davies-Bouldin index.
Understanding these performance metrics enables data scientists and engineers to build more reliable, interpretable, and effective AI systems. As artificial intelligence continues to shape industries and decision-making processes, the importance of accurate performance measurement will only continue to grow.